Rendering with PreonLab

September 05, 2023
Siddharth Marathe

As simulation engineers, we want to get our ideas and points across to stakeholders, managers, co-workers from other departments, and customers as efficiently as possible.
Typically, we back up our arguments by generating plots for statistics, which we put together to analyze our simulation results. We know exactly what all those numbers and multiple graphs and diagrams on every PowerPoint slide mean, and what conclusions need to be drawn from them to improve the product’s design.

However, this is not always the case for everyone else, who is looking at the presentation. It is possible that some viewers might even be viewing the results and concepts for the first time, without much in-depth technical knowledge. Furthermore, even the most experienced engineer or team member might interpret a simulation result inaccurately, if all they have time for is a quick glance at the data.
So, when it comes to communicating these results effectively, the message needs to be conveyed clearly – ideally in an appealing and easy-to-understand manner.
This can be quite challenging since there are many small details that matter, but we also do not want the viewer to lose focus from the big-picture point of the discussion. Showing graphs and numbers is important, but on its own this can be rather dry
.

Share:

What is the solution?

One of the best ways to present simulation results effectively is with the help of realistic images and videos.

For example, figure 1 (left) shows a PowerPoint slide illustrating the simulated cooling effect on the windings in an e-motor due to an impinging oil jet with the help of plots, numbers, and data. Using an eye-catching rendered image like the one depicted next to the graphs in figure 1 (right) can be crucial to effectively understand what the graphs indicate.

Figure 1: The simulated cooling effect on the windings in an e-motor due to an impinging oil jet illustrated with the help of plots, units, numbers, and data (left) vs the same visualized with the help of a rendered image/video. 

Such images and videos can be used to help explain what your data indicates, while you tell your story and keep your audience engaged.
Comparisons between product designs can be made directly, since the viewer can immediately visualize the impact made by changes to the design.
Especially when it comes to fluid simulation, the ability to visualize flows makes understanding the product, and the impact of various design parameters very intuitive and clear. You can track unwanted water entry into parts of your vehicle or visualize river water flow through an entire city, as shown in figure 2. Consider simulations like the oil distribution in a gearbox, or the impact of tire tread design in materials like snow. Photorealistic visuals take your simulations to the next level!

Figure 2: Visualization of water leakage inside a door of a car (top-left), a river water flow through a city (top-right), the oil distribution in a gearbox (bottom-left), and a tire imprint left in snow (bottom-right).

Rendering in PreonLab

Naturally, at FIFTY2, with our vision to build the ultimate simulation tool for our customers, it was imperative for us to include powerful rendering capabilities on top of the advanced post-processing features in PreonLab. Not only do we want our users to be able to perform rapid simulations and conveniently generate plots and track performance statistics, but we also want them to be able to generate impressive and eye-catching visuals to illustrate their point effectively to everyone.

With that in mind, we integrated two renderers in PreonLab. The first one is based on OpenGL and is the renderer which displays the simulation scene in the PreonLab GUI.
The second is our custom ray tracer – the powerful, in-built PreonRenderer – which lets users generate photo-realistic visuals to easily grab anyone’s attention and impress everyone with the simulation results. It can visualize fluid particles as small spheres and can also render smooth surfaces, as shown in figure 3.  The rendering of caustics is supported using a ray-tracing based technique called photon mapping. Although this is a computationally demanding process, it can greatly increase the realism of the visualization.

Figure 3: Side-by-side comparison of a realistic- and a particle-view rendering from a water wading simulation.

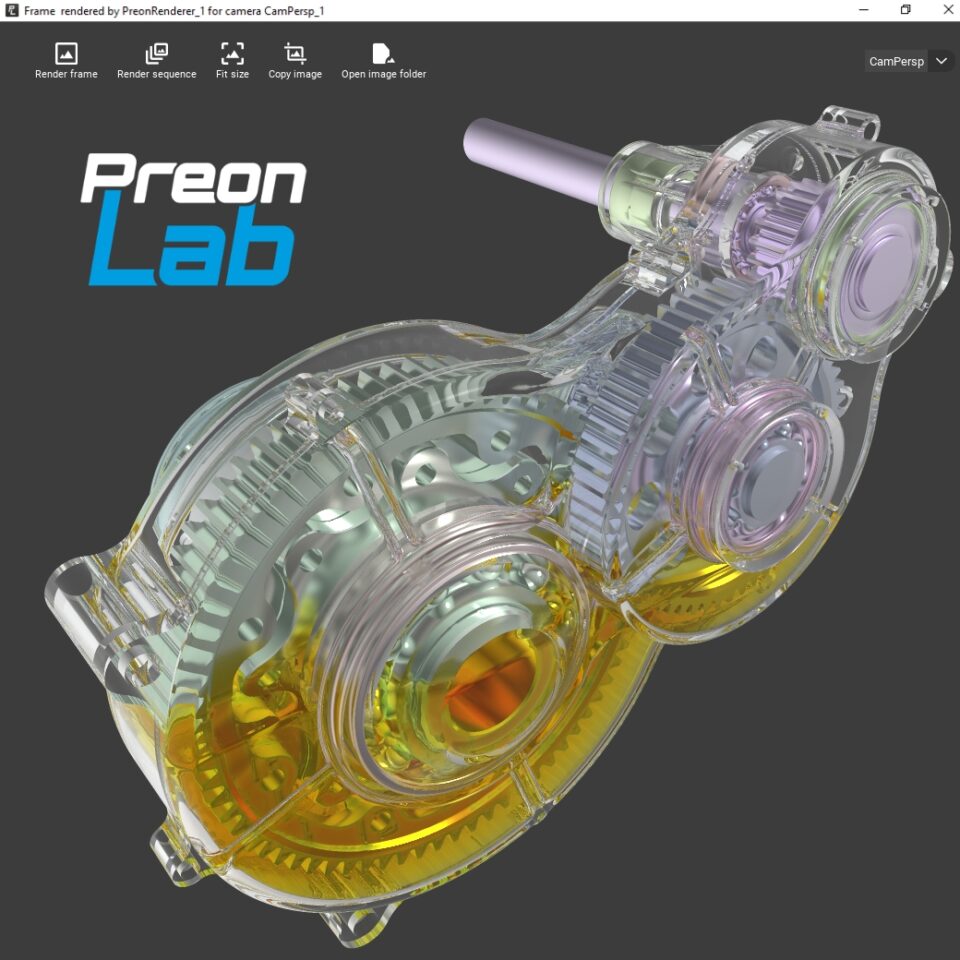
Both the integrated renderers in PreonLab can export visuals – whether it is a single image or an image sequence, which can then be externally converted to a video – with just a few clicks!
It is also possible to render images automatically during simulation. This is especially beneficial when, for example, simulating on a cluster or a computer without a graphics card.

Of course, PreonLab supports all the basic elements required for rendering like cameras, clipping objects, and directional and point lights – both of which are capable of casting shadows.
Additionally, all the objects in the scene you want to render can be assigned material properties.
Materials determine the appearance of solids and fluids. By default, every object is rendered using the DefaultMaterial which is present in every scene. You can insert and modify new materials just like other objects.
For this, you can make use of Surface materials, Textured surface materials as well as Volumetric materials.

  • The Surface material is based on the Phong illumination model. It consists of a diffuse, a specular, and an ambient term. The diffuse term models diffuse reflections of the material, which are independent from the viewer direction. In contrast, specular reflections are dependent on the viewer direction. Finally, the constant ambient term models indirect lighting, which is not captured by the diffuse and specular term.
    It should be noted, that simulating indirect light is not very easy, and although using the ambient term provides a good and efficient approximation, using it on its own does not offer adequate realism. To enhance the realism of the renderings and simulate indirect lighting more accurately, PreonLab supports advanced rendering features including a Monte Carlo method for light transport as well as the ability to include diffuse reflections. Using these features requires more processing power – however the result is well worth it!
  • A Textured surface material gives you the option to project a texture of your choice onto a given mesh. To specify UV coordinates, all you need is a plane.
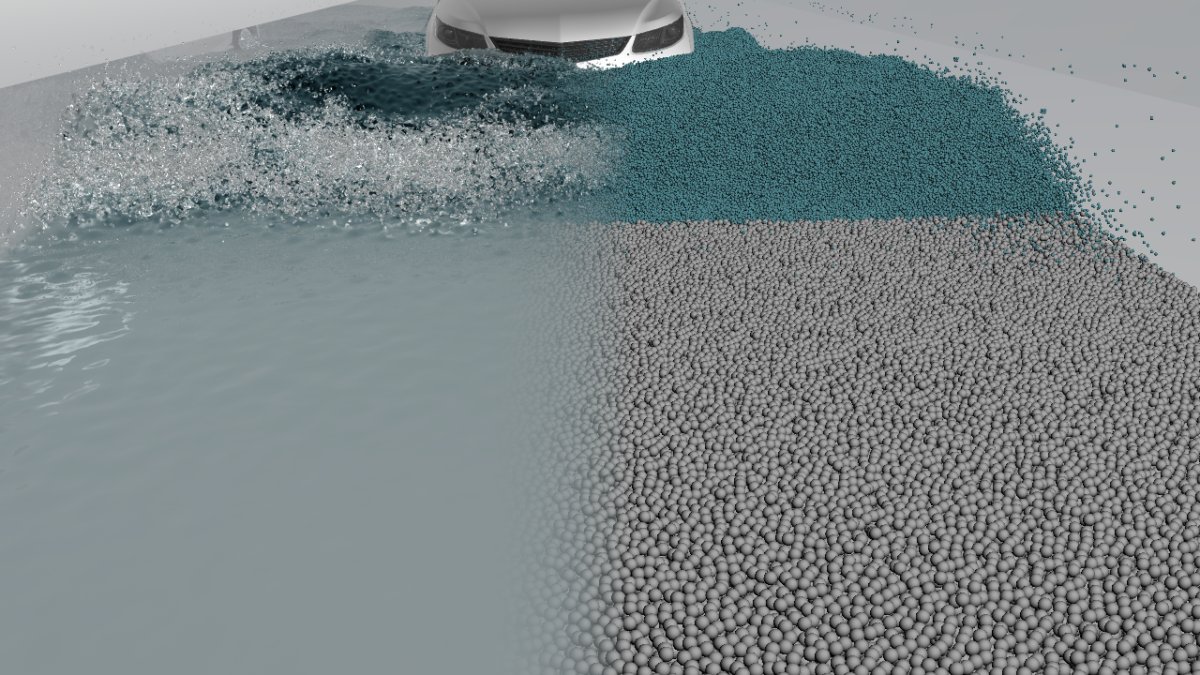
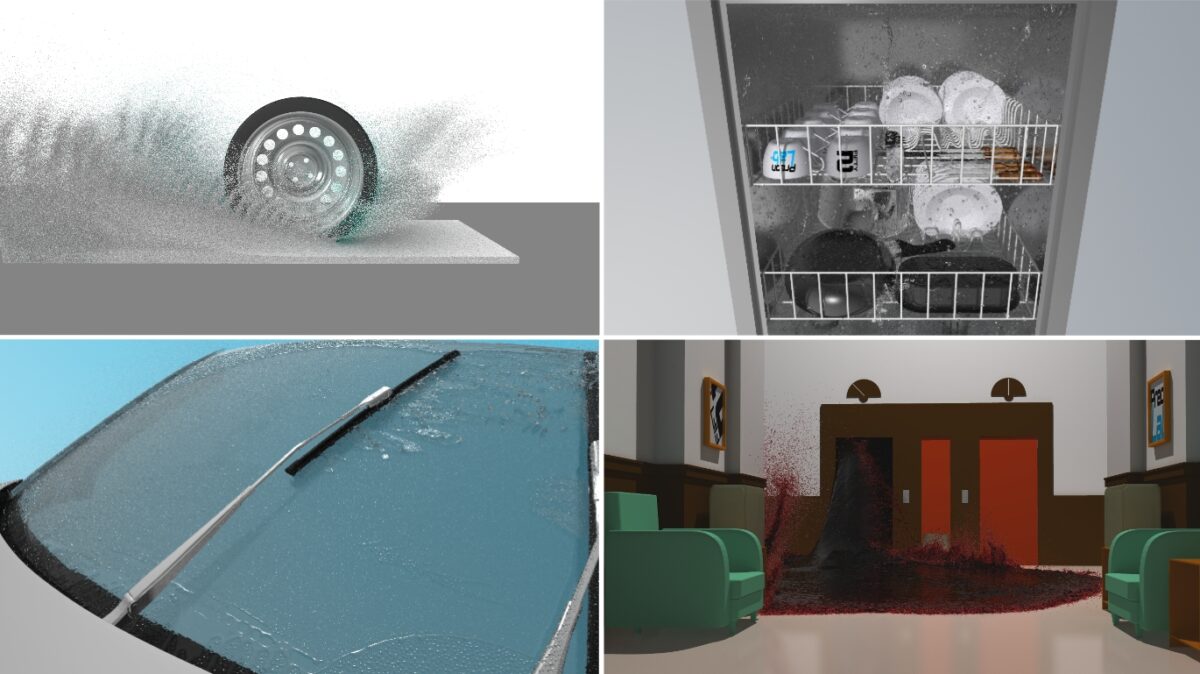
  • The Volumetric material is used to render volumetric mediums like water, oil or glass. It implements reflections, refractions, and absorption so that deep water may appear less translucent than shallow water. It also includes a specular term like the Surface material to model direct reflections from incident light into the camera. Additionally, a spray model, which is designed to improve the realistic visualization of waves and turbulent water is also provided with the Volumetric material.

Furthermore, PreonLab includes several material presets, which can be used by the user to generate photo-realistic renderings with ease. Assigning these presets to any selected objects and generating images is easy as pie as demonstrated by the following video:

Please agree to the transfer of data to third parties as set out in our privacy policy.

Video: Material Presets for Rendering in Preonlab

Putting all these elements together can lead to truly amazing results.
Figure 4 (top left) shows the visualization for a tire splash simulation using Surface material presets for the tire and particle rendering for the fluid. In figure 4 (top right) you can see a dishwasher simulation, where the water is rendered using the Volumetric material preset for water, while the solid objects are rendered with Surface materials as well as Textured surface materials for the logos on the cups.
You can showcase the realism of your simulations like the wiper simulation in figure 4 (bottom left) or play around with different settings as we did for a scene from the movie “the Shining”, for a bit of fun (bottom right).

Figure 4: Images showing a tire splash simulation (top left), dishwasher simulation (top right), wiper simulation (bottom left), and simulation of a scene from “The Shining” (bottom right).

Conclusion

The human brain is wired to retain visual information more effectively than any other type of information.  Being able to visualize the results of simulation not only helps understanding the design better but can also help gain more insights in an intuitive manner. Photorealistic visualization makes the results much more attractive and relatable for any viewer. As an engineer, you get great-looking results, and you are always looking forward to the next simulation. It is the cherry on the cake after all that know-how and expertise has gone into the simulation. Most importantly, the results can then be communicated effectively and in a captivating manner.

Over the years, we have seen some amazing results rendered with the PreonRenderer from many Preoneers all over the world.
We hope that all our users can benefit from the capabilities of the rendering tools in PreonLab – like the PreonRenderer – and leave a lasting impression
on all those to whom they present their results.

RELATED ARTICLES

LEARN MORE ABOUT PreonLab Updates

How to get started with
Preonlab CFD software?
Get in Touch