CFD Simulation of the E-coating Process in PreonLab

September 16, 2022
Saba Golshaahi Sumesaraayi and Max Flamm

When it comes to complex and costly automotive manufacturing processes, using reliable simulation tools to supplement expensive prototyping and physical testing has proven to be a very efficient method of optimizing the design stage. Therefore, the automotive industry is constantly looking for appropriate solutions for it. In the case of e-coating, this includes optimizing the various design parameters like tank dimensions, vehicle trajectory, line speed, and geometrical details of the vehicle body also known as Body in White (BIW). CFD tools, such as PreonLab, that provide not only high accuracy but also lean workflows and short computational times, are highly beneficial for this purpose. The ultimate goal is to gain reliable insights into how design parameters affect the process and to optimize these parameters. PreonLab provides powerful in-built post-processing tools for this purpose, including a wide range of options such as wetting, force, volume, and pathlines sensors.

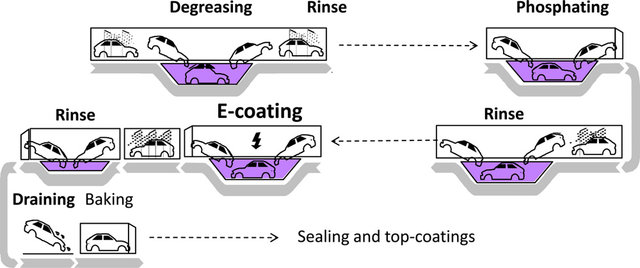
In this article, we will look at the e-coating process and show the capabilities of PreonLab in simulating and optimizing the fluid-dynamic aspects of this process.

Share:

E-coating

Surface coating is a common method for protecting industrial products from corrosion and other environmental influences. Electrophoretic coating (commonly referred to as e-coating for short) is a surface engineering process used to coat metallic components. An electric field is utilized in this process to ensure uniform paint deposition on parts with complex contours. These paint layers adhere firmly to the surfaces and provide excellent corrosion protection. [1]
E-coating is widely used, particularly in vehicle manufacturing. During this process, the entire vehicle body is often immersed in a bath and coated using electrophoretic processes. (Electrophoresis is the motion of particles relative to a fluid under the influence of an electric field.)

CFD Simulation and Analysis

A typical industrial cathodic e-coating process chain includes several key steps, which are depicted schematically in Figure 1. The major CFD-relevant steps in this process are the various rinsing steps, as well as the pretreatment (e.g. phosphating) and coating with the e-coat primer steps. Many of these steps, as shown in the diagram, involve a dip-and-drag-out movement of the vehicle in a fluid tank. These steps are the focus of this article, and later in the article, we will learn why.

​ Figure 1: A typical E-coating process chain. [2]

During the dip-and-drag-out movement, the vehicle body is first dipped into a bath of fluid (the fluid can be water, phosphating or other pretreatment fluids as well as the e-coat primer). While being translated and rotated through the tank following the designed dip-and-drag-out curve, it is dragged out of the liquid container.
To avoid carry-over cross-contamination caused by the leftover liquid, the fluid drainage process should be completed before moving the vehicle body to the next step. The size of the dip tank is determined by the dimensions of the workpieces and can range up to 400 m³ for painting the entire body in white, as shown in Video 1.

Please agree to the transfer of data to third parties as set out in our privacy policy.

Video 1: BMW paint shop in Munich.

In general, conventional CFD tools struggle to model the dip-and-drag-out movement, owing to the demanding task of dynamic mesh generation. It has been proved that not requiring mesh generation is advantageous for the simulation of such dynamic processes involving complex geometries. When modeling these steps of the process in PreonLab, the user is not required to generate a mesh for the vehicle or the fluid domain, let alone have them re-meshed during the simulation. Furthermore, PreonLab handles the reduction of the simulation domain size during the drainage phase automatically.

Except for the step with the e-coat primer, where electrophoresis was involved, PreonLab can completely and accurately simulate these steps of the process. This can be partially simulated in PreonLab, which means that the fluid dynamic aspects of the process can be modeled and simulated while the electrophoretic aspects are not taken into account. However, this is not a show-stopper for PreonLab when it comes to optimizing the e-coating process chain. The video below depicts a simulation of this stage of the process in PreonLab.

Please agree to the transfer of data to third parties as set out in our privacy policy.

Video 2: E-coating simulation results rendered in PreonLab.

Feature-Set Highlight

In this section, the most important features used in this simulation are introduced. Furthermore, some of these features are explained in terms of their importance.

  • The Continuous Particle Size algorithm, also called CPS for short

  • The surface-proximity refinement

  • The keyframing via PreonLab’s keyframe editor

  • The post-processing sensors, namely the force sensors, the volume sensors, as well as the wetting sensors

  • PreonPy; PreonLab’s Python API

  • PreonLab’s photo-realistic renderer, the Preon Renderer

The fluid domain for the dip-and-drag-out process is very large, as demonstrated in Video 1. The vehicle body, on the other hand, has very small holes. To accurately simulate the fluid flow affected by these holes, a sufficiently small particle size is required. However, at the time this article is being written and from a performance perspective, it may become nearly impossible to resolve the entire computational domain with such a small particle size.
As an outcome, the need for a smart particle refinement-and-coarsening algorithm is obvious; an algorithm that adapts particle sizes based on the required accuracy in the regions of interest. This is why the Continuous Particle Size algorithm is a game changer when it comes to simulating this application as shown in Video 3.

Please agree to the transfer of data to third parties as set out in our privacy policy.

Video 3: Continuous Particle Size (CPS) algorithm used in the CFD simulation of the dip-and-drag-out part of the process.

In most cases, including our example, using the Surface Proximity Refinement feature is very helpful and highly recommended in order to get the most out of the CPS algorithm. Surface proximity refinement allows you to define a refinement zone that follows the contour of the solid, simulating the fluid at a finer resolution in the vicinity of the solid’s surface. It is, therefore, similar to the mesh inflation layer used in traditional grid-based CFD approaches. In Video 4, you can see a small demonstration of this feature using the example geometry.

Please agree to the transfer of data to third parties as set out in our privacy policy.

Video 4: Surface Proximity Refinement in PreonLab 5.2.

Post-processing

Let’s take a look at the analysis possibilities, in other words, the insights that can be gained from modeling and simulating the dip-and-drag-out process in PreonLab.
The following are some of the most important post-processing sensors for this simulation:

  • Wetting sensor
  • Force sensor
  • Volume sensor

Wetting Sensor

PreonLab’s wetting sensors can determine whether or not each vehicle component is or has been in direct contact with the fluid at or up to a certain time frame. Additionally, the length of time each component has been in direct contact with the fluid can be tracked. The video below shows how wetting sensors were utilized for the post-processing of this simulation.

Video 5: The data from the wetting sensors used to colorize the vehicle body.

Force Sensor

PreonLab’s force sensors can measure the forces exerted on the vehicle body during the dip-and-drag-out process.

The user can measure the forces, stresses, and torques exerted on each and every part of the vehicle body using PreonLab’s force sensors, regardless of whether the metric of interest is the magnitude or a directional component. Moreover, the results can be easily exported and used as input for other simulations and post-processing tools.
Furthermore, engineers designing the e-coating process chain will benefit greatly from determining the force distribution on the vehicle body over time as well as predicting the maximum forces acting on each vehicle component. This also applies to the design and analysis engineers in charge of the solid mechanics aspects of the vehicle components, particularly those that are more critical in this scenario, such as the trunk compartment.
In Video 6, you can see how the cumulative maximum force field evolves on the vehicle body from various perspectives and with a focus on different vehicle components during the dip-and-drag-out process.

Please agree to the transfer of data to third parties as set out in our privacy policy.

Video 6: The evolution of the cumulative maximum force values acting on the vehicle body.

Volume Sensor

Using a volume sensor allows the user to easily calculate the fluid drainage time; the time it takes the vehicle body (or vehicle domains of higher importance) to be entirely drained (if at all).
Figure 2 depicts the evolution of the fluid volume within the red-highlighted box (which includes the entire vehicle body) over time. As expected, the measured volume reaches its maximum when the car is completely immersed in the liquid. The optimization can then be done either by redesigning the body (for example, by drilling more drainage holes into it) or by modifying the drag-out-curve. One primary goal is to reduce the time required for this step of the e-coating process so that the next step of the process chain can begin earlier while avoiding cross-contamination between tanks due to leftover liquid or soiling of subsequent workbenches.

Figure 2: The evolution of the fluid volume in the vehicle over time.

Figure 3: The evolution of the fluid volume in the trunk compartment over time.

Figure 3 illustrates the same analysis for the part of the vehicle that we were most interested in this example: the trunk compartment. The evolution of the liquid volume over time can be seen, but only for the trunk compartment.

Detection and Export of Fluid Puddles

When focusing on the final stage of the process (See Figure 3 and Video 7), it can be seen that some liquid remains in the compartment and will most likely never be drained. This is very common in the industry for initial design variants. If this is the case, the engineers will undoubtedly be interested in redesigning either the process or the vehicle body to eliminate the leftover liquids.
Engineers are more often interested in larger liquid puddles. In such scenarios, it is critical for design and analysis engineers to be able to automatically determine the fluid puddles that form as a result of fluid left-over. With this information, they would be able to optimize the vehicle body design as well as the dip-and-drag-out curve if necessary. This can be done for any vehicle body and dip-and-drag-out curve design variant combination.

Video 7: The left-over fluid puddles in the vehicle body.

It is possible to detect fluid puddles automatically using PreonLab’s Python API, PreonPy. In this example, we were looking for fluid puddles larger than or equal to 10 mL at the end of the simulation, with a focus on the trunk compartment.

At the time of interest, 6 puddles larger than or equal to 10 mL were detected, as shown in Figure 4. The orange dots represent the center of each puddle.

Figure 4: Detected fluid puddles (larger or equal to 10 mL).

The leftover fluid puddles can be meshed using PreonLab’s built-in mesher, namely the Preon Mesher. The meshes can then be exported fully or partially as CAD files. These can then be imported into other software for simulation, design, or analysis purposes. (See Figure 5)

Figure 5: Meshed fluid puddles.

Much more insight might, of course, be acquired based on the demands of the design and analysis engineers from the simulation of an e-coating process in PreonLab, which provides a variety of post-processing options such as contours and convenient plotting utilizing PreonLab’s built-in plot feature.

Performance

On 64 cores, the simulation time for 100 physical seconds was around 60 hours. Furthermore, depending on the refinement settings and the amount of already deleted particles, the fluid particle count ranged from 180 thousand to 9 million particles.
The slope begins to rise significantly around 52 seconds. Let’s take a closer look at why this is so. The relationship between the increase in computational effort and the number of fluid particles can be easily determined in this example, as shown in Figure 6. Please take note of how the particle count suddenly increases at around 52 seconds. This is the result of the addition of a second refinement domain to the setup. When the vehicle body starts to emerge from the fluid tank and the drainage begins, this additional refinement domain with a smaller target particle size is activated.
As a result, we end up with more particle size levels, which leads to an increase in the number of particles and, thus, higher computational costs. However, this is the correct strategy since finer particle size in regions with small dimensions is essential for obtaining highly accurate results in an efficient manner.

Figure 6: The growing number of particles (caused by an additional refinement domain) affecting the computational time.

Conclusion

PreonLab offers unique features that greatly facilitate e-coating process chain design and assist engineers in identifying flaws in the process chain architecture before it is even constructed. Owing to PreonLab’s ease of use and the elimination of the requirement to generate a computational mesh, the user can quickly set up an e-coating simulation.
With the help of CPS, proximity refinement, and powerful solver algorithms, PreonLab is able to accurately predict fluid behavior in the regions of interest efficiently. Furthermore, with built-in sensors, it is easy to predict drainage times, visualize forces on the vehicle, and evaluate design proposals. Moreover, with the built-in Python API (PreonPy), it is possible to enable target-specific and complex post-processing strategies to extract the most insight out of the simulation.

References

[1] kluthe.com

[2] G-L. Song, A dipping E-coating for Mg alloys, Progress in Organic Coatings,
Volume 70, Issue 4, 2011, pp. 252-258, doi.org/10.1016/j.porgcoat.2010.09.028

RELATED ARTICLES

LEARN MORE ABOUT PreonLab Updates

How to get started with
Preonlab CFD software?
Get in Touch